30. Jun 2018
matplotlib stat generator
This is a production notebook. It uses data gathered from a PBX and internal routing and will generate reports for TT, ACW and so on.
It is meant to be customizeable, so one can easily adjust
- the time range that should be evaluated
- different plots are available for
- hotline data
- agent data
- call distribution
The script can also easily iterate time ranges over the whole dataset and produce plots for each
This script makes little sense to use from a CLI, it's meant to run in an IPython Environment
script code
a markdown dump straight out of the notebook:
%load_ext autoreload
%autoreload 2

## Import necessary modules
import os,sys
import pandas as pd
import matplotlib.pyplot as plt
from matplotlib.dates import date2num, AutoDateFormatter, AutoDateLocator, WeekdayLocator, MonthLocator, DayLocator, DateLocator, DateFormatter
from matplotlib.dates import MO, TU, WE, TH, FR, SA, SU
from matplotlib.ticker import AutoMinorLocator, AutoLocator, FormatStrFormatter, ScalarFormatter
import numpy as np
import datetime, calendar
from datetime import timedelta
import matplotlib.patches as mpatches
from itertools import tee
from traitlets import traitlets

sys.path.append(os.path.abspath('/home/keuch/gits/keuch/code_box/pyt/spreadsheetparsing/entwuerfe/xls_testruns/lib/'))
from ce_funclib import determine_kernzeit as dtkz
from ce_funclib import continuity_check


from ipywidgets import widgets, interact, interactive, fixed, interact_manual, Layout
from IPython.display import display
#%matplotlib inline
%matplotlib tk


## Import data frome pickle generated from muß ein file mit agentenstats sein
arcpth='/home/keuch/gits/keuch/code_box/pyt/spreadsheetparsing/test_stats/archiv/'
######## GET A LIST OF MATCHING .xls FILES FROM THE GIVEN DIRECTORY

def collectxlfiles(arcpath):
    xlfilelist=list()

    for xlfile in os.listdir(arcpath):
        if xlfile.startswith('CE_alle_Ag'):
            xlfileabs=os.path.join(arcpath,xlfile)
            xlfilelist.append(xlfileabs)
    return sorted(xlfilelist)

xlfilelist=collectxlfiles(arcpth)
#xlfilelist
#examplefile=xlfilelist[233]
###### TEST FOR DATA IN FILE, SORT OUT EMPTY FILES

## good dataframes do per definition not contain any zero values
## fill bad DFs with nan?

def filetoframe(exfile):
    exframe=pd.read_excel(exfile) # this is a regular pd.DataFrame
    datecell=exframe.iloc[0,1]
    sheet_datetime=pd.to_datetime(datecell,format='%d.%m %Y : %H')
    sheet_date=sheet_datetime.date()

    integritycheck=exframe.iloc[2,1] # files with data have "agenten" here, files with no calls have a 'nan'

    if integritycheck != 'Agenten':
        # if it's empty, keep date for filling it later
        print('Exception: ', end='')
        except_status='ex'

        usefulcols={0:'tstamp',1:'agent',3:'an',4:'be',22:'vl',24:'ht_float',29:'tt_float'} # map cols to decent names
        exframe=exframe.reindex(columns=sorted(usefulcols.keys()))
        exframe.rename(columns=usefulcols,inplace=True)
        exframe=exframe[0:1] # strip text rows and the mangled sum row
        print(sheet_datetime)

        exframe['tstamp']=sheet_datetime
        exframe['date']=sheet_date
        exframe['agent']='nocalls_datum'
        exframe[['wd','ww','mm','yy']]=exframe['tstamp'].dt.strftime('%a,%W,%m,%Y').str.split(',',expand=True) # make ww,yy,mm,wd columns
        exframe['bz']=exframe['tstamp'].apply(dtkz)
        exframe['ort']=exframe['agent'].str[0] # split the identifier into useable columns
        exframe['id']='foobar' # split the identifier into useable columns

        # integers should be of appropriate datatype, we received them as strings
        # exframe[['vl','an','be','ww','mm','yy']]=exframe[['vl','an','be','ww','mm','yy']].astype(np.int64) #just for the beauty of it
        exframe.fillna(0, inplace=True)
        exframe[['ww','mm','yy']]=exframe[['ww','mm','yy']].astype(np.int64) #just for the beauty of it
        #exframe.fillna(0, inplace=True)
        return exframe,except_status

    else:
        except_status='reg'

        exframe.columns=range(0,30) # rename columns to a temporarily more readable format, fancy rename later
        usefulcols={0:'tstamp',1:'agent',3:'an',4:'be',22:'vl',24:'ht_float',29:'tt_float'} # map cols to decent names
        exframe=exframe[sorted(usefulcols.keys())] # skip cols and keep the ones we need
        exframe.rename(columns=usefulcols,inplace=True) # rename cols
        exframe=exframe[3:-1] # strip text rows and the mangled sum row
        exframe['tstamp']=pd.to_datetime(exframe['tstamp'],format=' %d.%m.%Y %H:%M ')
        exframe['date']=exframe['tstamp'].dt.date
        exframe[['wd','ww','mm','yy']]=exframe['tstamp'].dt.strftime('%a,%W,%m,%Y').str.split(',',expand=True) # make ww,yy,mm,wd columns
        exframe['bz']=exframe['tstamp'].apply(dtkz)

        exframe['ort']=exframe['agent'].str[0] # split the identifier into useable columns
        exframe['id']=exframe['agent'].str[-6:] # split the identifier into useable columns
        exframe['agent']=exframe['agent'].str[2:-7] # split the identifier into useable columns

        # integers should be of appropriate datatype, we received them as strings
        exframe[['vl','an','be','ww','mm','yy']]=exframe[['vl','an','be','ww','mm','yy']].astype(np.int64) #just for the beauty of it

        return exframe,except_status
framelist=list()
exceptionlist=list()
for xfile in xlfilelist:
    frame_from_file,except_status=filetoframe(xfile)
    if except_status=='ex':
        exceptionlist.append(xfile)
    framelist.append(frame_from_file)
Exception: 2017-04-17 00:00:00
Exception: 2017-05-14 00:00:00
Exception: 2017-11-19 00:00:00
Exception: 2017-12-03 00:00:00
Exception: 2017-12-10 00:00:00
Exception: 2018-03-04 00:00:00
Exception: 2018-03-11 00:00:00
Exception: 2018-04-08 00:00:00
#### produce a unified frame with all data and sort it by timstamp and agentname
bigframeii=pd.concat(framelist)
bigframeii.sort_values(['tstamp','agent'],inplace=True)
bigframeii.reset_index(drop=True,inplace=True) # there you go
# die exklusivlogins müssen zusammengelegt werden
unify_id={'gesinst':'995887','stanzju':'878457','papkeda':'891914'}
bigframeii.loc[bigframeii['id'] == unify_id['gesinst'],'agent'] = 'gesinst'
bigframeii.loc[bigframeii['id'] == unify_id['stanzju'],'agent'] = 'stanzju'
bigframeii.loc[bigframeii['id'] == unify_id['papkeda'],'agent'] = 'papkeda'
#### check, ob alle Daten(Tage) lückenlos sind
datenserie_uniq=bigframeii['date'].unique().tolist()
tage_bestand=len(datenserie_uniq)
tage_start=datenserie_uniq[0]
tage_ende=datenserie_uniq[-1:]

missing_dates=continuity_check(datenserie_uniq)
if not missing_dates:
    print('no dates are missing')
else:
    print('the following dates are not within the frame:')
    print(missing_dates)
no dates are missing
# get all agents available and create frames for kern and neben
allagents_list=sorted(bigframeii['agent'].unique())
allagents_list.extend(['Hagenow','Berlin','Alle'])
standorte=bigframeii.ort.unique().tolist()
we can't figure out individual calls anyway, since raw data calls have been grouped by hours already
so we can go on and group by days to figure out averages
bigframeii.head(2)
#Samstage = bigframeii.loc[(bigframeii['tstamp'].dt.dayofweek ==  5)
|
tstamp |
agent |
an |
be |
vl |
ht_float |
tt_float |
date |
wd |
ww |
mm |
yy |
bz |
ort |
id |
| 0 |
2017-03-04 08:00:00 |
beckfra |
1.0 |
1.0 |
0.0 |
2.3667 |
2.1333 |
2017-03-04 |
Sat |
9 |
3 |
2017 |
n |
H |
216694 |
| 1 |
2017-03-04 08:00:00 |
tetzlva |
1.0 |
1.0 |
0.0 |
2.6833 |
2.6167 |
2017-03-04 |
Sat |
9 |
3 |
2017 |
n |
B |
613887 |
Datum_MIN = bigframeii.tstamp.dt.date.min()
Datum_MAX = bigframeii.tstamp.dt.date.max()

Datum_VON = datetime.date(2017,5,1)   # YY,MM,DD
Datum_BIS = datetime.date(2018,10,1)

Kernzeit = (bigframeii['bz'] ==  'k')
Nebnzeit = (bigframeii['bz'] ==  'n')

Berlin = (bigframeii['ort'] ==  'B')
Hagenow = (bigframeii['ort'] ==  'H')

Wunschzeitraum = ((bigframeii.tstamp.dt.date >= Datum_VON) & (bigframeii.tstamp.dt.date <= Datum_BIS))
#bigframeii.loc[Wunschzeitraum & Kernzeit & Hagenow] # SUPER!
kzdata=bigframeii.loc[Wunschzeitraum & Kernzeit].copy()
kzdata_reindex=kzdata.set_index(['tstamp','ort']).copy() # timestamps und Standort als neue Indizes
kzdata_byday=kzdata_reindex.groupby([pd.TimeGrouper('D', level='tstamp'), pd.Grouper(level='ort')]).sum() # nach Tagen gruppiert und alle Zahlen summiert
def plotzi(frame):

    aht,aacw,att,nzb,bg ="#003873","#EE0042","#899EB2","#C7798F","#FEFFE2"
    sonntage=WeekdayLocator(byweekday=(6), interval=2)
    datevon=frame.index.get_level_values('tstamp').min().strftime('%d.%m.%y')
    datebis=frame.index.get_level_values('tstamp').max().strftime('%d.%m.%y')


    #### ------------------------------------ ####

    fig=plt.figure(figsize=(12,5))

    ax=fig.add_subplot(111)
    ax.margins(0,0)
    ax.set_facecolor(bg)
    ax.set_xlabel('Kernzeit / ceDis von '+datevon+' bis '+datebis)
    ax.xaxis.set_major_locator(sonntage)
    ax.xaxis.set_major_formatter(DateFormatter('%d.%m.%y'))
    ax.set_ylabel('Calls angenommen')


    ber=frame.xs('B', level=1, drop_level=True)['an']
    hgw=frame.xs('H', level=1, drop_level=True)['an']

    b=ax.bar(ber.index,ber.values, label='calls', color=nzb, width=1)
    h=ax.bar(hgw.index,hgw.values, label='calls', color=aht, width=0.6)

    plt.setp(ax.xaxis.get_majorticklabels(), rotation=45, horizontalalignment='right', size=6 )

    bercalls=int(ber.sum())
    hgwcalls=int(hgw.sum())
    allecalls=bercalls+hgwcalls
    anteilhgw=str(    format((hgwcalls/allecalls)*100,'.2f')   )
    anteilber=str(    format((bercalls/allecalls)*100,'.2f')   )


    callsBH = mpatches.Patch(color='000000', label='Calls Ber+Hgw: '+str(allecalls))
    callsB = mpatches.Patch(color=nzb, label='Calls Ber: '+str(bercalls) +' ('+anteilber+'%)'        )
    callsH = mpatches.Patch(color=aht, label='Calls Hgw: '+str(hgwcalls) +' ('+anteilhgw+'%)'        )

    ax.legend(handles=[callsBH,callsB,callsH],fontsize=8,ncol=2,loc='upper right',borderaxespad=-2,framealpha=0.99)

    plt.subplots_adjust(bottom=0.25)
plotzi(kzdata_byday)
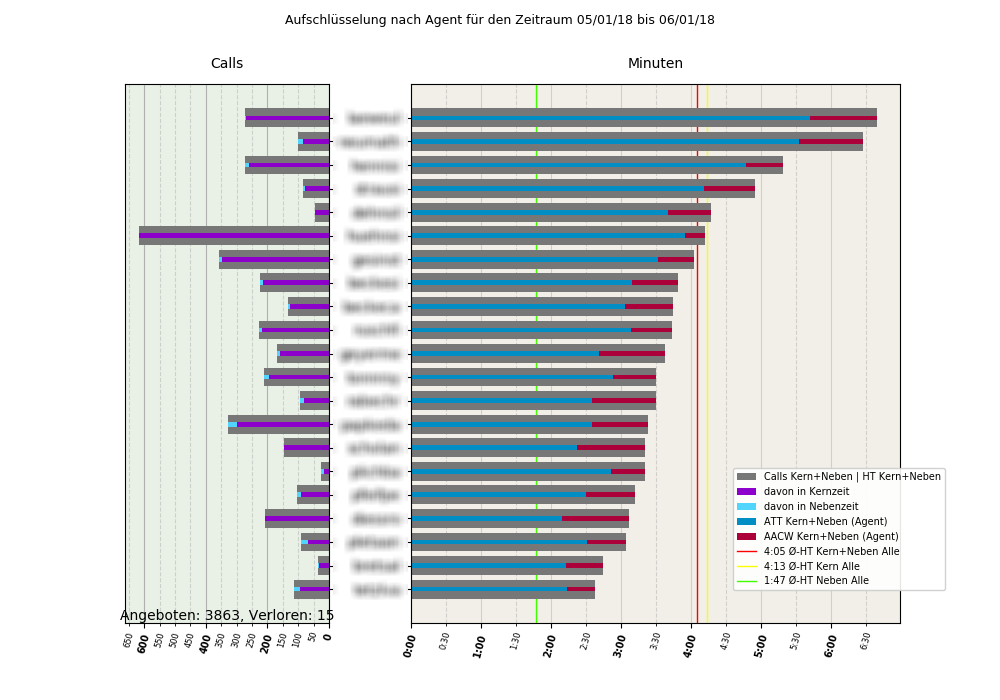
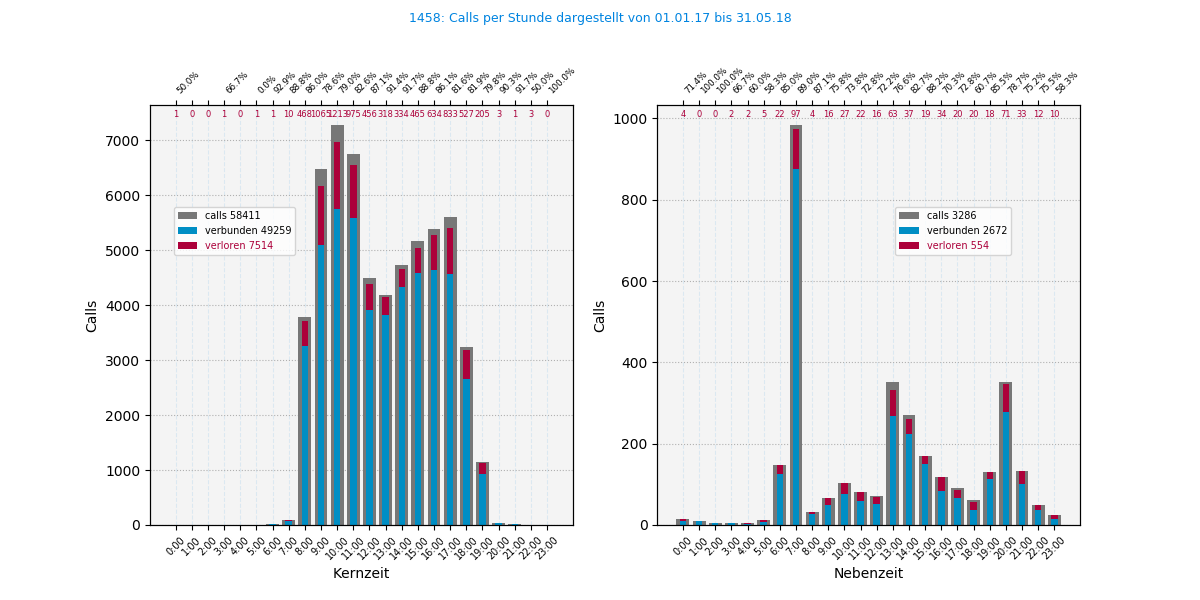
example plots:


